In our original blog post, What Makes Coronavirus Headlines (real and fake) Go Viral? we presented our major findings on why some headlines and images are more viral than others.
Here, we will take a slightly more in-depth look at how we went about answering that question.
Methods Summary

(Left) Representation of images we analyzed to identify associations of virality in images of coronavirus articles. (Right) Representation of most frequently used words used in the 11.300 Coronavirus headlines analyzed. Larger words are more common.
First, we scraped and analyzed 11.333 headlines and images from Western news websites that were published between the fifth of December 2019 and 11th of March 2020, using the Aylien News API.
Then, we calculated the normalized velocity
Normalized Share Velocity
Since articles have a time component to them, we wanted all articles to be comparable. Thus, the term share velocity is used to describe the relationship between # of Facebook shares/(time delta between posting and measuring # shares).
By extension, normalized share velocity is calculated by Facebook share velocity/average velocity of COVID news pieces posted in the particular site of origin.
By normalizing share velocity, popularity differences are taken into account between the various news sources.
Here on out, we will use the term normalized success score as a stand in term for normalized share velocity.
Thus, a news article that has a normalized success score (i.e.share velocity) of 5 means that that specific news article was shared 5 times faster than a typical article on that site.
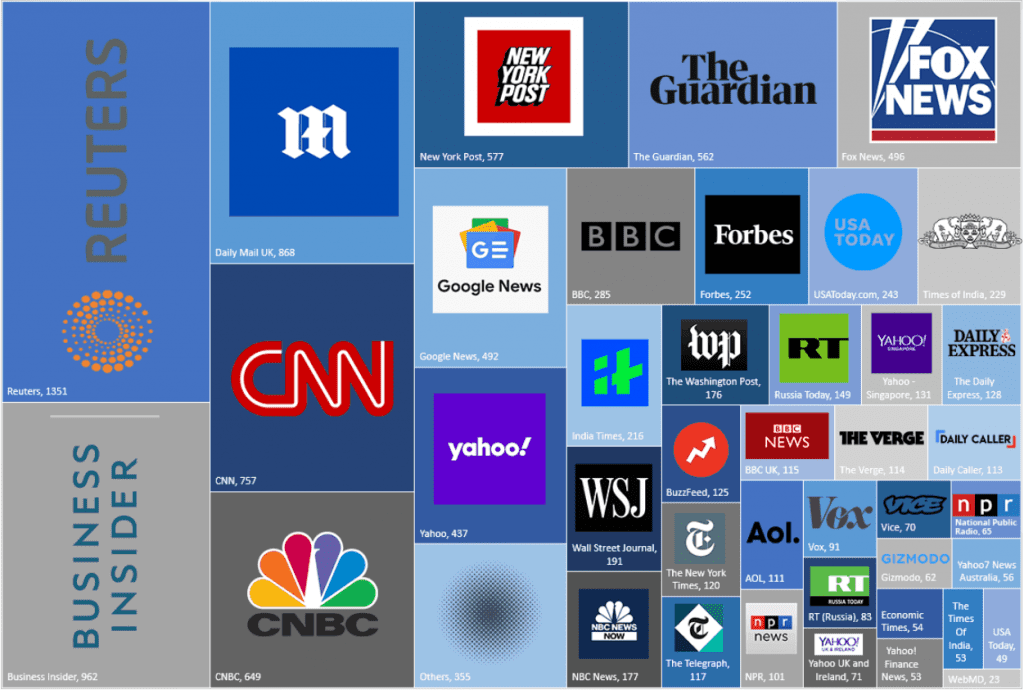
The sources of news article headlines and images with the respective count and source name.
Word Embedding Models
We used our word embedding models to explore which associations were present within these headlines and images. Then, we used a variety of methods to calculate the relationship between associations and the number of shares the content received. These included simple correlations and more advanced statistical methods that can determine the impact of different factors on an outcome, like which associations achieve more shares [for more details click here].
From the identified associations, we established which associations contributed to higher shareability.
To return to the original blog post, click here: What Makes Coronavirus Headlines (real and fake) Go Viral?