
Evaluation metrics and statistical reliability for synthetic respondents are now the only honest way to separate a marketing-grade synthetic panel from a glossy demo. By the start of 2026, 62 percent of market researchers had used synthetic data in the last six months, yet 40 percent still flag data quality as their top concern[1]. This article is the technical companion to our parent guide on the accuracy of AI digital twins versus traditional surveys, and it gives a research director, insights manager, or AI-first marketing leader the concrete statistical toolkit needed to interrogate any vendor claim in a single meeting.
Key Takeaways
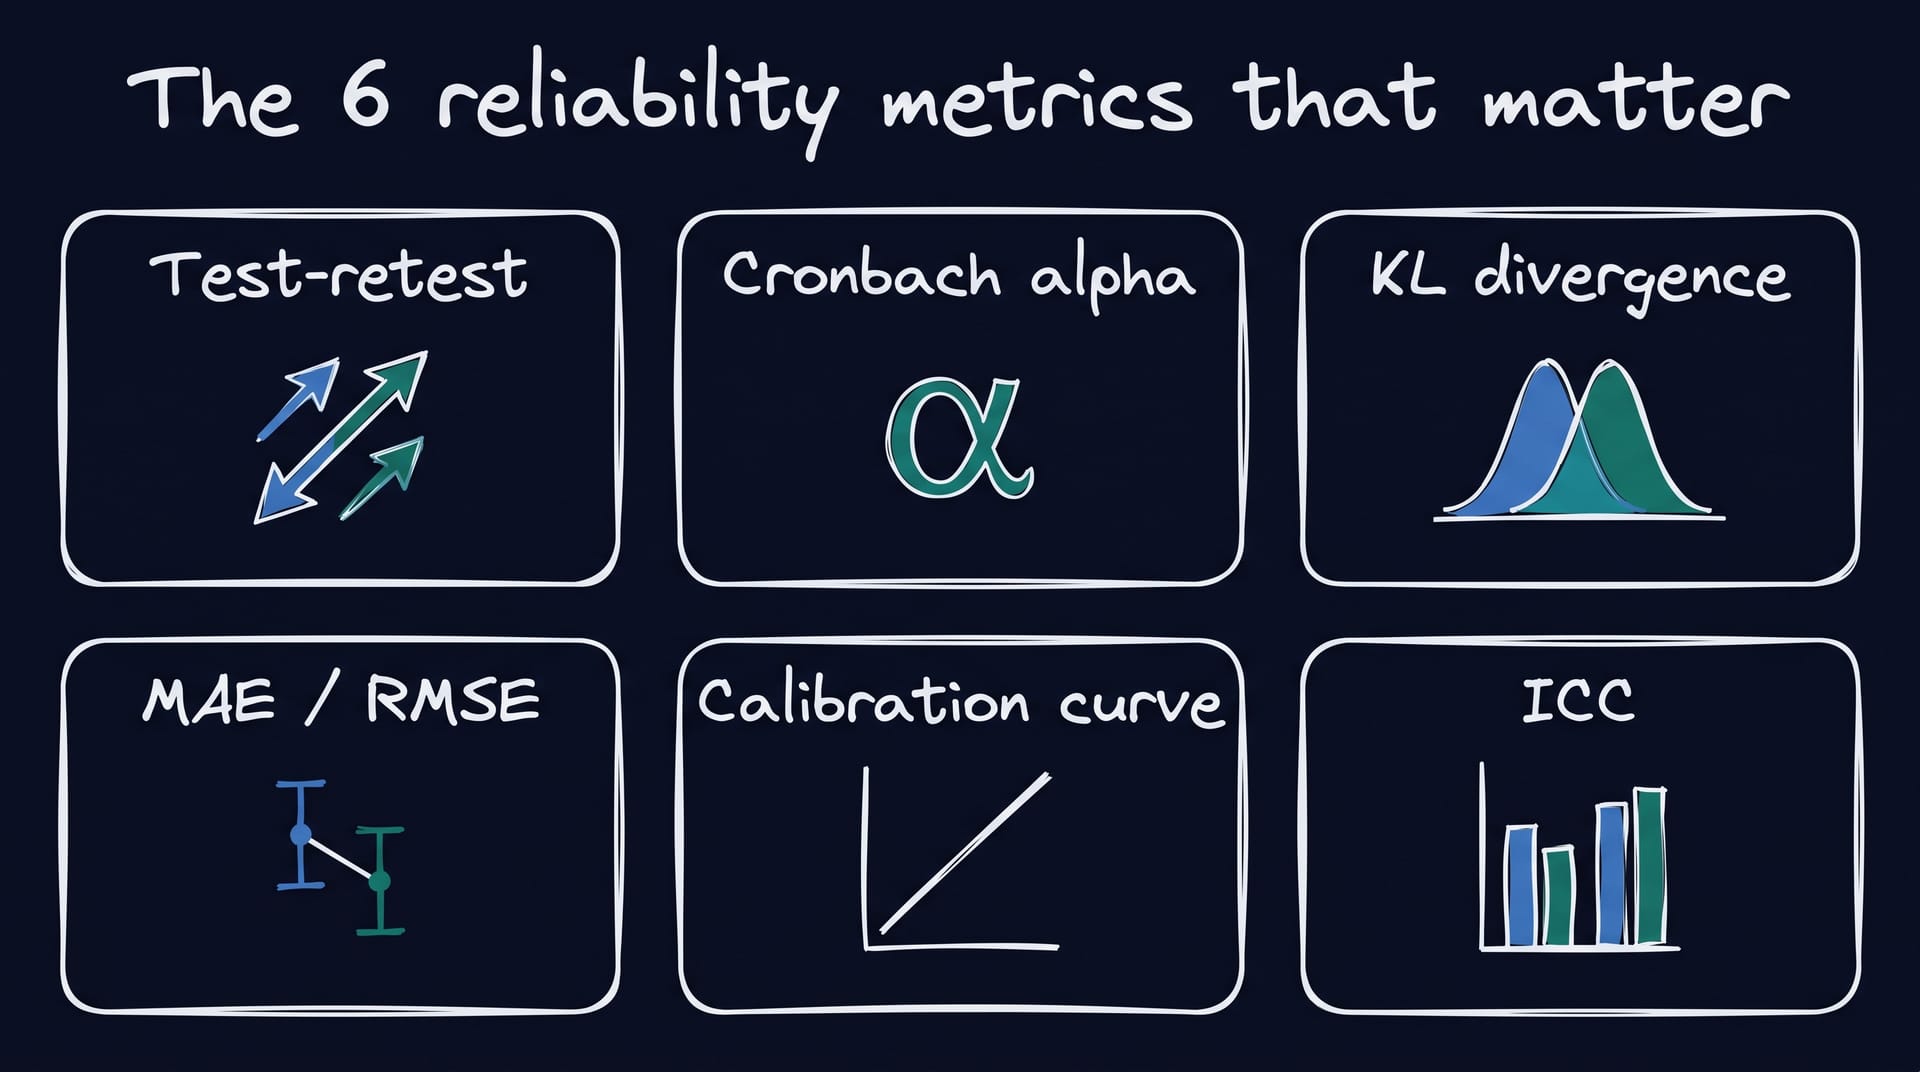
- The six metrics that actually matter for synthetic respondents are test-retest reliability, Cronbach’s alpha, KL divergence, MAE or RMSE on benchmark questions, calibration curves, and the intraclass correlation coefficient (ICC).
- Honest thresholds: test-retest ρ at or above 0.90 is excellent, Cronbach’s alpha at or above 0.80 is strong internal consistency, KL divergence below 0.10 indicates strong distribution alignment, and ICC at or above 0.75 is good agreement[2][3].
- A peer-reviewed PyMC Labs and Colgate-Palmolive study across 57 surveys and 9,300 human respondents showed synthetic respondents reaching 90 percent of human test-retest reliability and distributional similarity above 85 percent[4].
- Stanford and Google DeepMind’s 1,052-participant study replicated General Social Survey answers at 85 percent normalized accuracy, matching the test-retest reliability of the humans themselves two weeks later[5].
- A vendor that cannot give you confidence intervals, a published benchmark, and a reproducible reliability score is not statistically reliable. They are selling vibes.
Why classical reliability metrics still apply to synthetic respondents
The temptation with anything labeled AI is to throw out a century of measurement theory and replace it with whatever the dashboard shows. Resist that. Classical psychometrics built the reliability framework precisely because survey responses are noisy. The three pillars of measurement quality, validity, reliability, and generalizability, all still apply when the respondent is a calibrated digital twin instead of a person on a screen.
A synthetic respondent is, mathematically, a draw from a conditional distribution. The question is whether that distribution is anchored on real human data, whether it returns the same answer when asked the same question twice, and whether the spread of answers across the panel matches the spread you would see in a real population. That is what reliability metrics measure. Skipping them because the data is synthetic is exactly the failure mode the methodology of credible AI consumer panels is designed to catch: any vendor missing a validation chain is selling a demo, not a method.
The six metrics that actually matter for synthetic respondents
These are the six numbers a research-grade synthetic panel should be able to show on request. Together they tell you whether the platform is reliable, replicable, and grounded in real human variance.
Test-retest reliability (ρ). Re-run the same study with the same calibration two weeks later. The correlation between the two waves is your test-retest coefficient. For a real human panel this typically sits between 0.75 and 0.90 depending on question type[5]. Anything above 0.90 on a synthetic panel is excellent. The Stanford and DeepMind 1,052-person study set the public bar by matching human test-retest reliability at 85 percent normalized accuracy[5].
Cronbach’s alpha (α). Internal consistency across items measuring the same construct. The convention: above 0.70 is acceptable, above 0.80 is strong, above 0.90 is excellent[2]. One peer-reviewed analysis found LLM-generated panels hitting a mean alpha of 0.87 versus 0.75 for the human comparator[6], which is a double-edged result: high consistency is good, but consistency above the human baseline can signal the panel has stripped out real-world noise. Both directions need to be watched.
KL divergence. Kullback-Leibler divergence measures how much one probability distribution differs from another. For single-select survey questions, KL divergence between the synthetic and real-panel distributions below 0.10 indicates strong alignment, below 0.05 is excellent[7]. One published Simsurveys validation against the IFIC Food and Health Survey reported KL divergences of 0.041 on dietary guidelines familiarity, 0.009 on protein attitudes, and 0.008 on fiber awareness[7]. That is the kind of number to demand.
Mean Absolute Error (MAE) and Root Mean Square Error (RMSE) on benchmark questions. When the answer is numerical, the synthetic mean should sit close to the real-panel mean. MAE and RMSE quantify how close. The Greenbook 2026 replication study reported a Cohen’s d deviation of 0.07 standard deviations between synthetic and human answers on eight attitudinal questions, a tight result for opinion measurement[8]. As a rule of thumb, the synthetic panel should land inside the real panel’s confidence interval on the benchmark question; if it lands outside, the calibration has drifted.
Calibration curves. Borrowed from machine learning, a calibration curve plots the predicted probability against the observed frequency. If the synthetic panel reports 70 percent purchase intent and the real-world conversion is 35 percent, the curve sags below the diagonal and the model is overconfident. A flat, diagonal calibration curve is what you want, and a low Brier score (closer to zero) summarises the calibration in a single number[9]. This is the metric that catches false-precision overfitting, where the dashboard prints 78.4 percent but the underlying model cannot defend the decimal.
Intraclass correlation coefficient (ICC). ICC measures agreement across repeated raters or repeated waves. ICC below 0.50 is poor, 0.50 to 0.75 is moderate, 0.75 to 0.90 is good, and above 0.90 is excellent[10]. For a synthetic panel, ICC across waves is a tougher test than a simple Pearson correlation because it controls for systematic shifts, so it is the metric of choice when you want to know whether the panel is stable, not just correlated. This is the bridge to the broader story of bias in AI market research: systematic shifts in ICC are usually the first place bias surfaces in the numbers.
How to read a vendor’s reliability claim
“Eighty-five to ninety-five percent panel parity” sounds confident and is the headline number across the live market[5][4]. But the same phrase can hide three different things. It can mean Pearson correlation between synthetic and real means on a benchmark question, which is the loosest version. It can mean test-retest reliability between two synthetic waves, which says nothing about the human comparator. Or it can mean a held-out validation parity score against a real human slice, which is the only version that answers the question the C-suite is actually asking.
A vendor whose reliability claim is research-grade should always volunteer four things: which benchmark dataset the claim is anchored on (GSS, ANES, IFIC, an internal one), which metric the percentage refers to, the confidence interval around the point estimate, and the date of the last validation cycle. If any of the four is missing the claim is marketing. Red flags include single-number accuracy claims with no metric specified, a refusal to release the validation methodology under NDA, parity claims against the model’s own training distribution rather than a held-out human slice, and a 95 percent number with no confidence band. The limitations of synthetic market research become visible exactly where these red flags surface, and the more honest the vendor, the more they will admit them up front.
Benchmark frameworks: the gold-standard datasets to test against
Reliability claims are only as good as the benchmark behind them. Five public or semi-public datasets are emerging as the de facto reliability gold standards for synthetic respondents, and any serious vendor should be able to name at least one.
The General Social Survey (GSS) is the dataset behind the 85 percent Stanford and DeepMind replication score, covering attitudes, beliefs, and demographics across decades[5]. The American National Election Studies (ANES) is the political analogue, useful for opinion measurement and segmentation tests. The Eurobarometer offers cross-country opinion benchmarks for European-market validation. The Advertising Research Foundation (ARF) datasets from the Foundations of Quality initiative compare 17 commercial panels against probability benchmarks on purchase intent and behavior[11], and the ARF has a live synthetic-respondent comparison initiative against traditional panels[11]. The IFIC Food and Health Survey has emerged as a public CPG benchmark with around 3,000 U.S. adults, used in published Simsurveys validation work[7].
Beyond public datasets, the strongest reliability signal is a real-vs-synthetic A/B test run on a category the vendor has not seen before. If the vendor will commit to that test under NDA with a published reliability score, the methodology is mature. The choice of benchmark also has a downstream effect on how the panel is deployed across a marketing and CRM stack: the same reliability score on the wrong category benchmark will mislead the next decision, even if the math is clean.
A practical six-step evaluation workflow
The six metrics and the benchmarks combine into a clean evaluation rubric any insights team can run in one sprint. Skip a step and the next decision rests on a number nobody can defend.
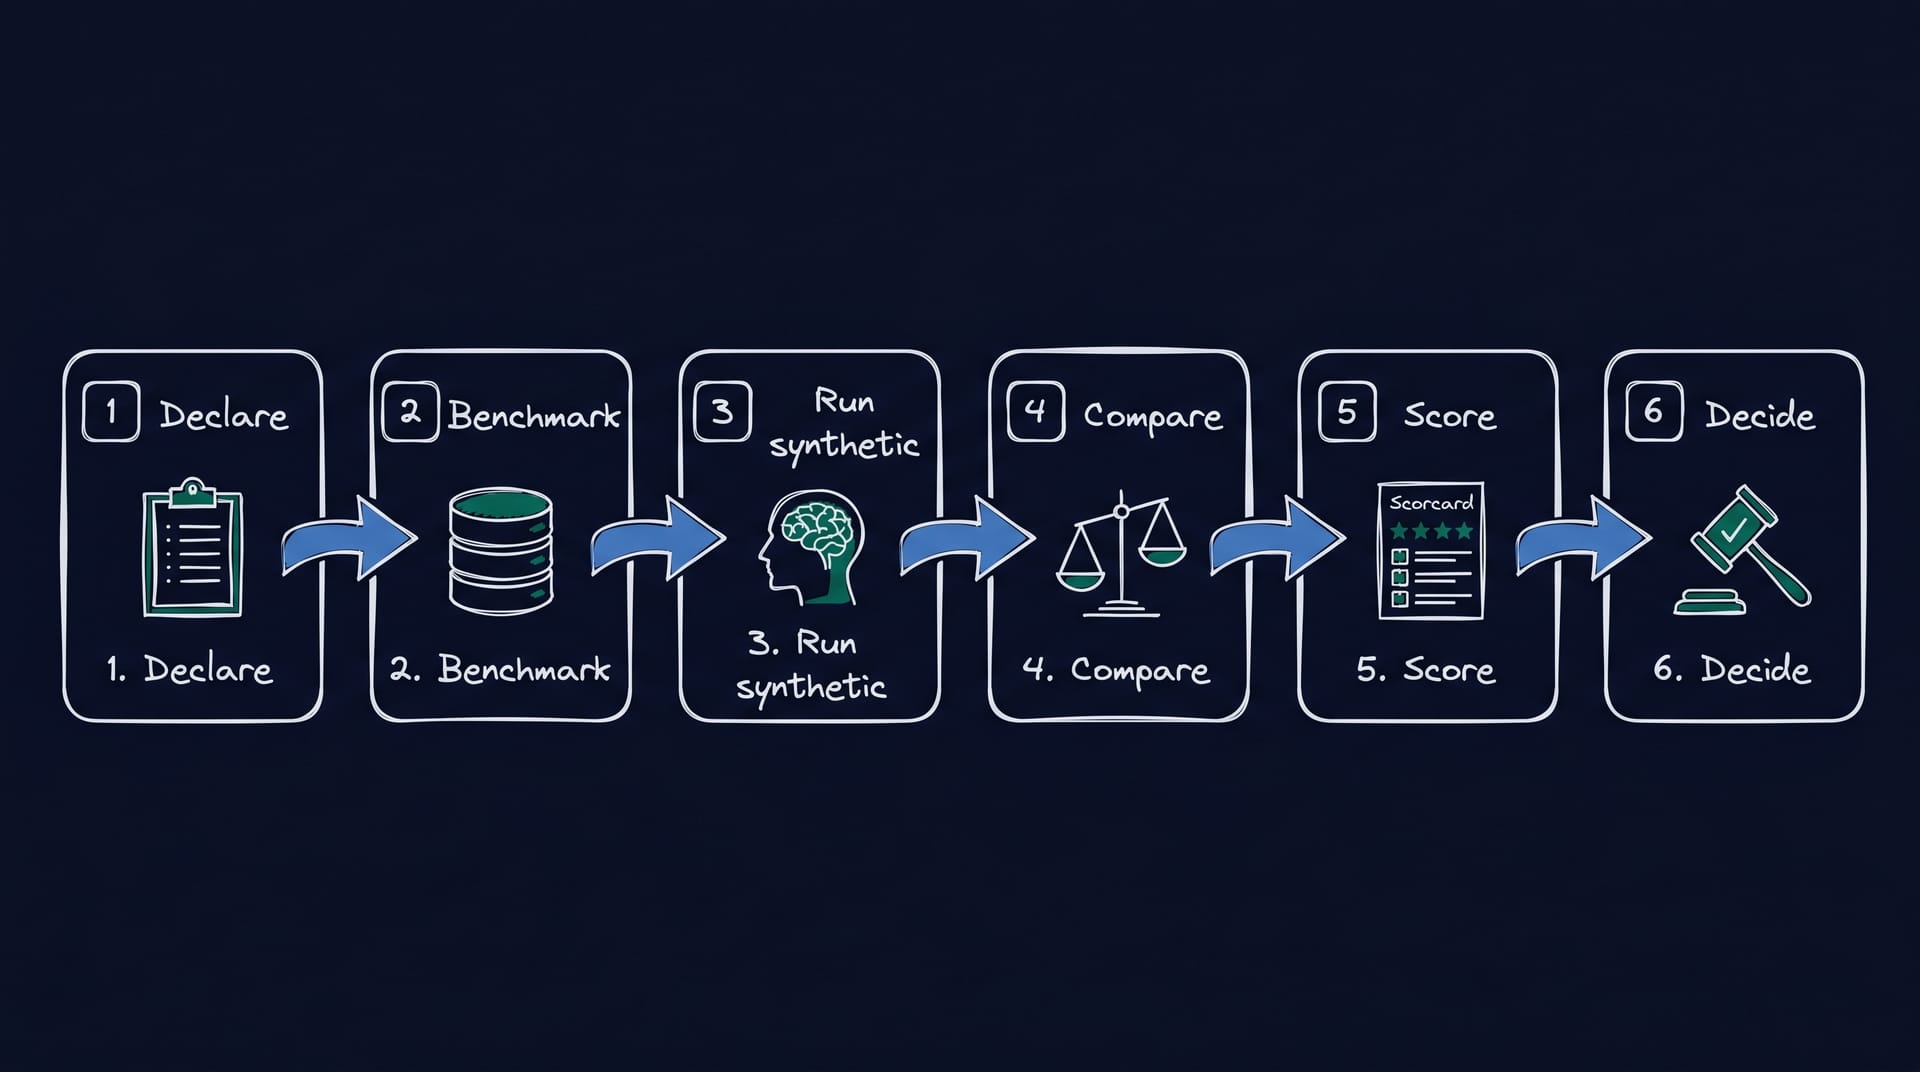
Step 1: Declare the hypothesis. Write the decision the study has to support and the cost of getting it wrong. That sets the parity bar. A pricing call needs tighter parity than a directional concept screen.
Step 2: Pick the benchmark. Choose a real human dataset or a held-out slice that matches the category, the segments, and the question types. No benchmark, no number.
Step 3: Run the synthetic study. Run the panel under production conditions, not a tuned demo. Include the same demographic and segment quotas you would on a real panel.
Step 4: Compare to ground truth. Pull the real-panel distribution for the same questions and align response scales.
Step 5: Score on the six metrics. Compute test-retest ρ, Cronbach’s alpha, KL divergence, MAE or RMSE on the benchmark items, the calibration curve, and ICC. Report each with a confidence band, not a point estimate.
Step 6: Decide. If all six metrics sit in their honest thresholds, run synthetic-first for the first 80 percent of the decision and reserve a human top-up for the final 20 percent on the leading candidates. If three or more metrics miss, the methodology is not yet decision-grade and the panel is a directional tool, not a substitute for a real study. This pragmatic split is the same one that powers the go-to-market validation workflow on calibrated synthetic panels.
Common reliability pitfalls and how to avoid them
Four failure modes show up repeatedly across vendor pitches and quickly invalidate an otherwise clean reliability claim.
LLM monoculture. Every synthetic respondent inherits the same training-data priors, so the panel collapses toward the model’s average rather than the population’s real variance. Cronbach’s alpha looks suspiciously high (above 0.95 across constructs that should sit in the 0.70 to 0.85 range), and the KL divergence on edge cases blows up. Multi-model and multi-seed generation paired with calibration on real-panel variance is the fix.
Prompt drift. Minor wording changes swing the synthetic answer well outside real-panel variance, destroying test-retest reliability. Prompt versioning, a regression test on every release, and ICC tracked over time catch this. If the vendor cannot show their prompt versioning, assume drift is present.
Sample-size theater. Ten thousand synthetic answers generated from three calibration profiles are not a sample of ten thousand. They are three personas with noise. The metric that matters is unique calibrated profiles per generated answer, not the headline count. A platform anchoring 68 to 255 calibration data points per twin from a million-plus real-profile pool is in a different methodological league than one with three demographic fields.
False-precision overfitting. The dashboard prints 78.4 percent. The calibration curve is sagging by 12 points. The model has learned to be confidently wrong. A calibration curve audit and the Brier score catch this, and the responsibility to surface the result lives squarely with the audit trail that the ethics and privacy framework for AI market research makes a hard requirement under the 2025 ICC/ESOMAR Code revision[12].
Pressure-test any synthetic panel claim with neuroflash
neuroflash is the platform for insights teams that need to defend a number to the board, not just present one. Every concept, claims, message, and pricing test runs on a calibrated panel anchored on more than one million real consumer profiles, with 68 to 255 calibration data points per twin and 85 to 95 percent parity with real human panels on the six reliability metrics that matter. Validation against 80-plus academic studies is in the open, every output ships with a confidence interval, and the audit trail is on by default so the methodology survives the first reviewer meeting. Run your first reliability-graded study free and see the metrics end to end before committing to a vendor or the choice of AI market research provider for the next budget cycle.

FAQ
What is the single most important reliability metric for a synthetic respondent panel?
If you only get one number, ask for test-retest reliability with a confidence interval, computed against a real human comparator and a published benchmark. It captures whether the same panel returns the same answer twice and whether the answer is anchored on real human behavior, which is the floor for any defensible insights decision.
How does Cronbach’s alpha behave differently on synthetic versus human panels?
LLM-generated panels often report higher alpha than human comparators, with a published mean of 0.87 versus 0.75[6]. High consistency is desirable, but alpha above 0.95 on a construct that should sit in the 0.70 to 0.85 range is a warning sign of LLM monoculture and noise stripping, not better data. Treat alpha as a sanity check against the human baseline, not a leaderboard score.
What KL divergence threshold separates a research-grade synthetic panel from a marketing demo?
Below 0.10 indicates strong distribution alignment, below 0.05 is excellent[7]. Published validation studies report KL divergences as low as 0.008 on tight, well-defined attitudinal questions. Anything above 0.20 is directional at best and should not be used to make a budget decision.
How do I run the six-metric workflow without a data science team?
The workflow is the bottleneck, not the math. Most modern synthetic panel platforms will compute the six metrics for you on request, with a confidence interval and a benchmark of your choice. If a vendor will not, the methodology is not ready. Insights teams can also run a lightweight version using ICC and KL divergence in any statistics package against a documented benchmark like the IFIC or GSS slice the vendor names.
Does statistical reliability guarantee real-world predictive accuracy?
No. Reliability is necessary, not sufficient. A panel can be perfectly reliable on a benchmark question and still mispredict a real-world launch if the calibration data does not cover the right segments, or if the question is about behavior the synthetic respondent has never been exposed to. Reliability is the floor. Real-world A/B tests are the ceiling, and both belong in the evaluation.
Final Thoughts
By 2027 every serious vendor of synthetic respondents will publish a reliability scorecard. The platforms that publish a six-metric report card with confidence intervals will win the long contracts. The ones that hold up a single 95 percent number will lose on the first audit. The job of an insights leader, an AI-first decision-maker, or a research director is to make sure the budget rests on numbers somebody can defend two years from now, not just on the demo somebody saw last quarter. The six metrics on this page are the cleanest way to get there. The synthetic panel that survives them is the one worth building on.
References
[1] GreenBook (2025): “2025 GRIT Insights Practice Report.” https://www.greenbook.org/grit/insights-practice-edition
[2] Tavakol, M. and Dennick, R. (2011): “Making Sense of Cronbach’s Alpha.” International Journal of Medical Education. https://pmc.ncbi.nlm.nih.gov/articles/PMC4205511/
[3] Koo, T. K. and Li, M. Y. (2016): “A Guideline of Selecting and Reporting Intraclass Correlation Coefficients for Reliability Research.” Journal of Chiropractic Medicine. https://pmc.ncbi.nlm.nih.gov/articles/PMC4913118/
[4] Maier, B. F. et al. (2025): “LLMs Reproduce Human Purchase Intent via Semantic Similarity Elicitation of Likert Ratings.” https://arxiv.org/html/2510.08338v1
[5] Park, J. S. et al. (2024): “Generative Agent Simulations of 1,000 People.” Stanford University and Google DeepMind. https://arxiv.org/pdf/2411.10109
[6] Limited Ability of LLMs to Simulate Human Psychological Behaviours: a Psychometric Analysis (2024). https://arxiv.org/pdf/2405.07248
[7] Simsurveys (2025): “Synthetic Consumer Data vs. the IFIC Food and Health Survey.” https://simsurveys.com/blog/ific-food-health-validation
[8] GreenBook (2026): “Testing Synthetic Data Against Academic Benchmarks: A Replication Study.” https://www.greenbook.org/insights/data-science/testing-synthetic-data-against-academic-benchmarks-a-replication-study
[9] Gneiting, T. and Resin, J. (2023): “Evaluating Probabilistic Classifiers: The Triptych.” https://arxiv.org/pdf/2301.10803
[10] Mehta, S. et al. (2018): “Performance of Intraclass Correlation Coefficient (ICC) as a Reliability Index Under Various Distributions in Scale Reliability Studies.” Statistics in Medicine. https://onlinelibrary.wiley.com/doi/10.1002/sim.7679
[11] Advertising Research Foundation (2024): “ARF Original Research and Foundations of Quality.” https://thearf.org/submit/arf-original-research/
[12] ESOMAR (2025): “ICC/ESOMAR International Code on Market, Opinion and Social Research and Data Analytics, Revision 2025.” https://iccwbo.org/news-publications/business-solutions/iccesomar-international-code-market-opinion-social-research-data-analytics/


